
geospatial visualization
Accessibility Analysis
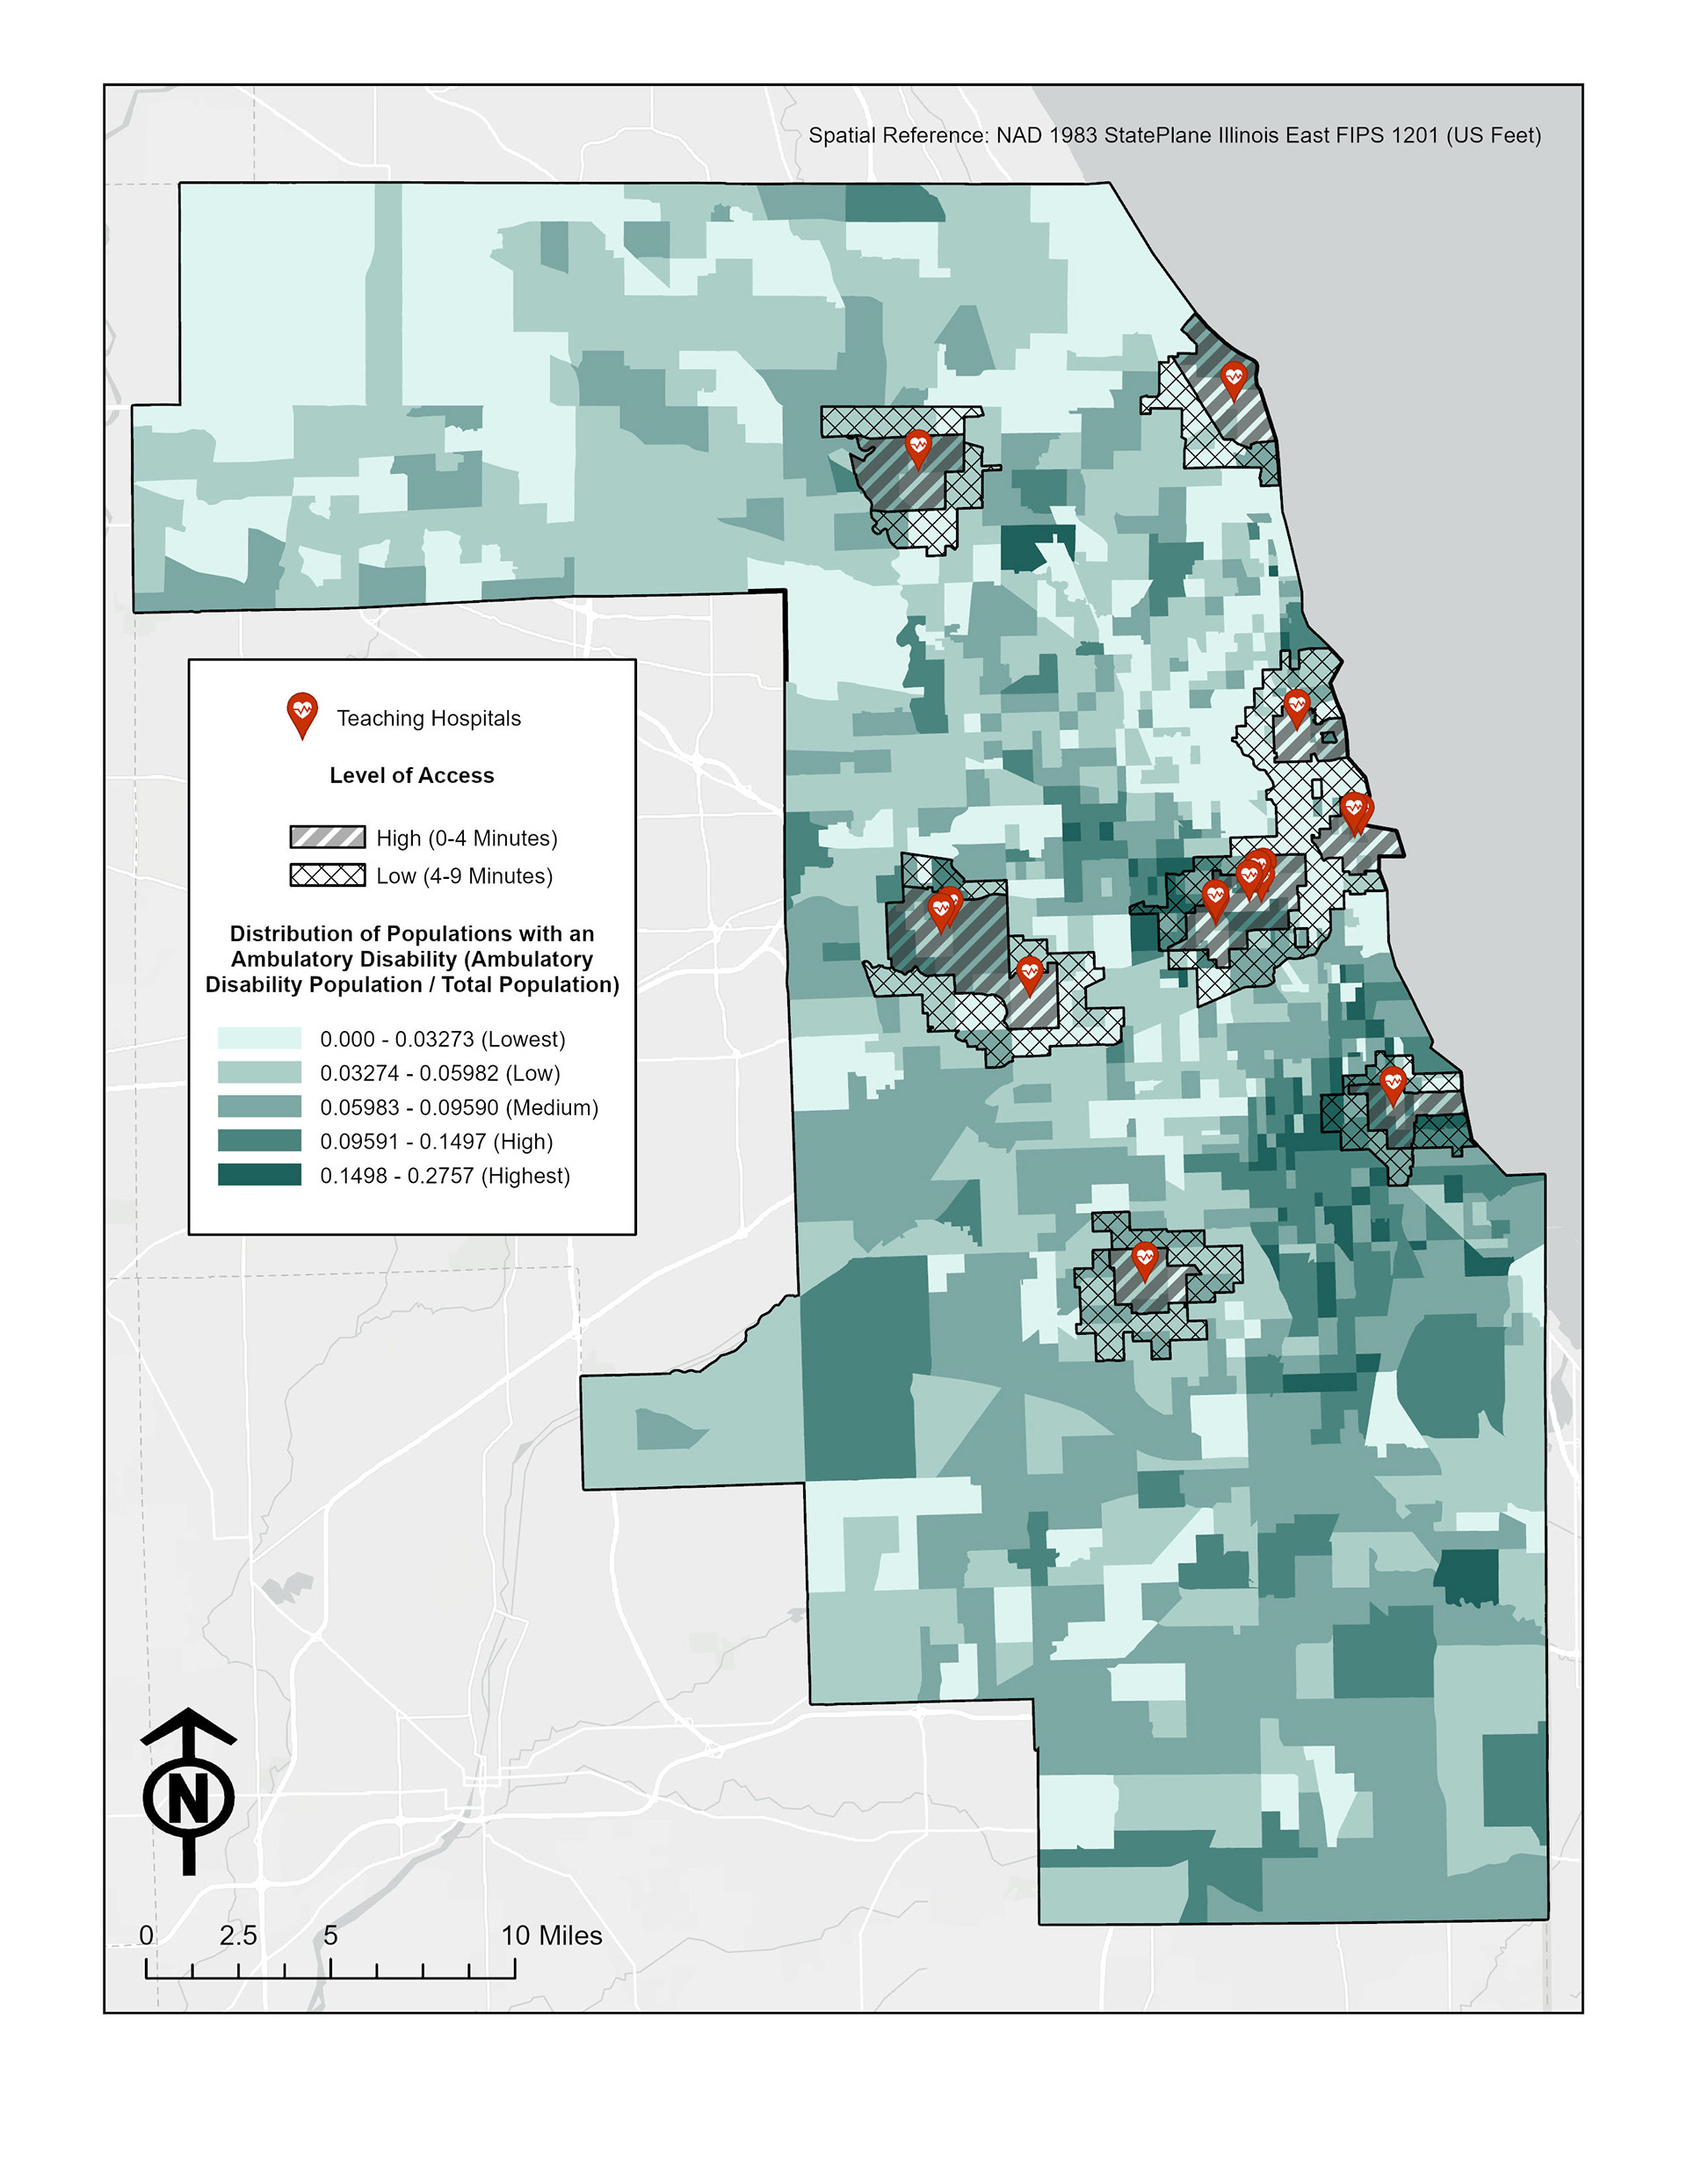
Teaching hospitals, also known as Academic Medical Centers, provide high-quality care while training future healthcare professionals. Patients, particularly those with disabilities, benefit from their advanced services, research, and innovative technologies. In Cook County, 17 of more than 70 hospitals are teaching hospitals. This analysis uses GIS to examine emergency access to these facilities based on real-world travel times and the distribution of disabled and ambulatory-disabled populations.
Skills: ArcGIS Pro
Population Density Visualization
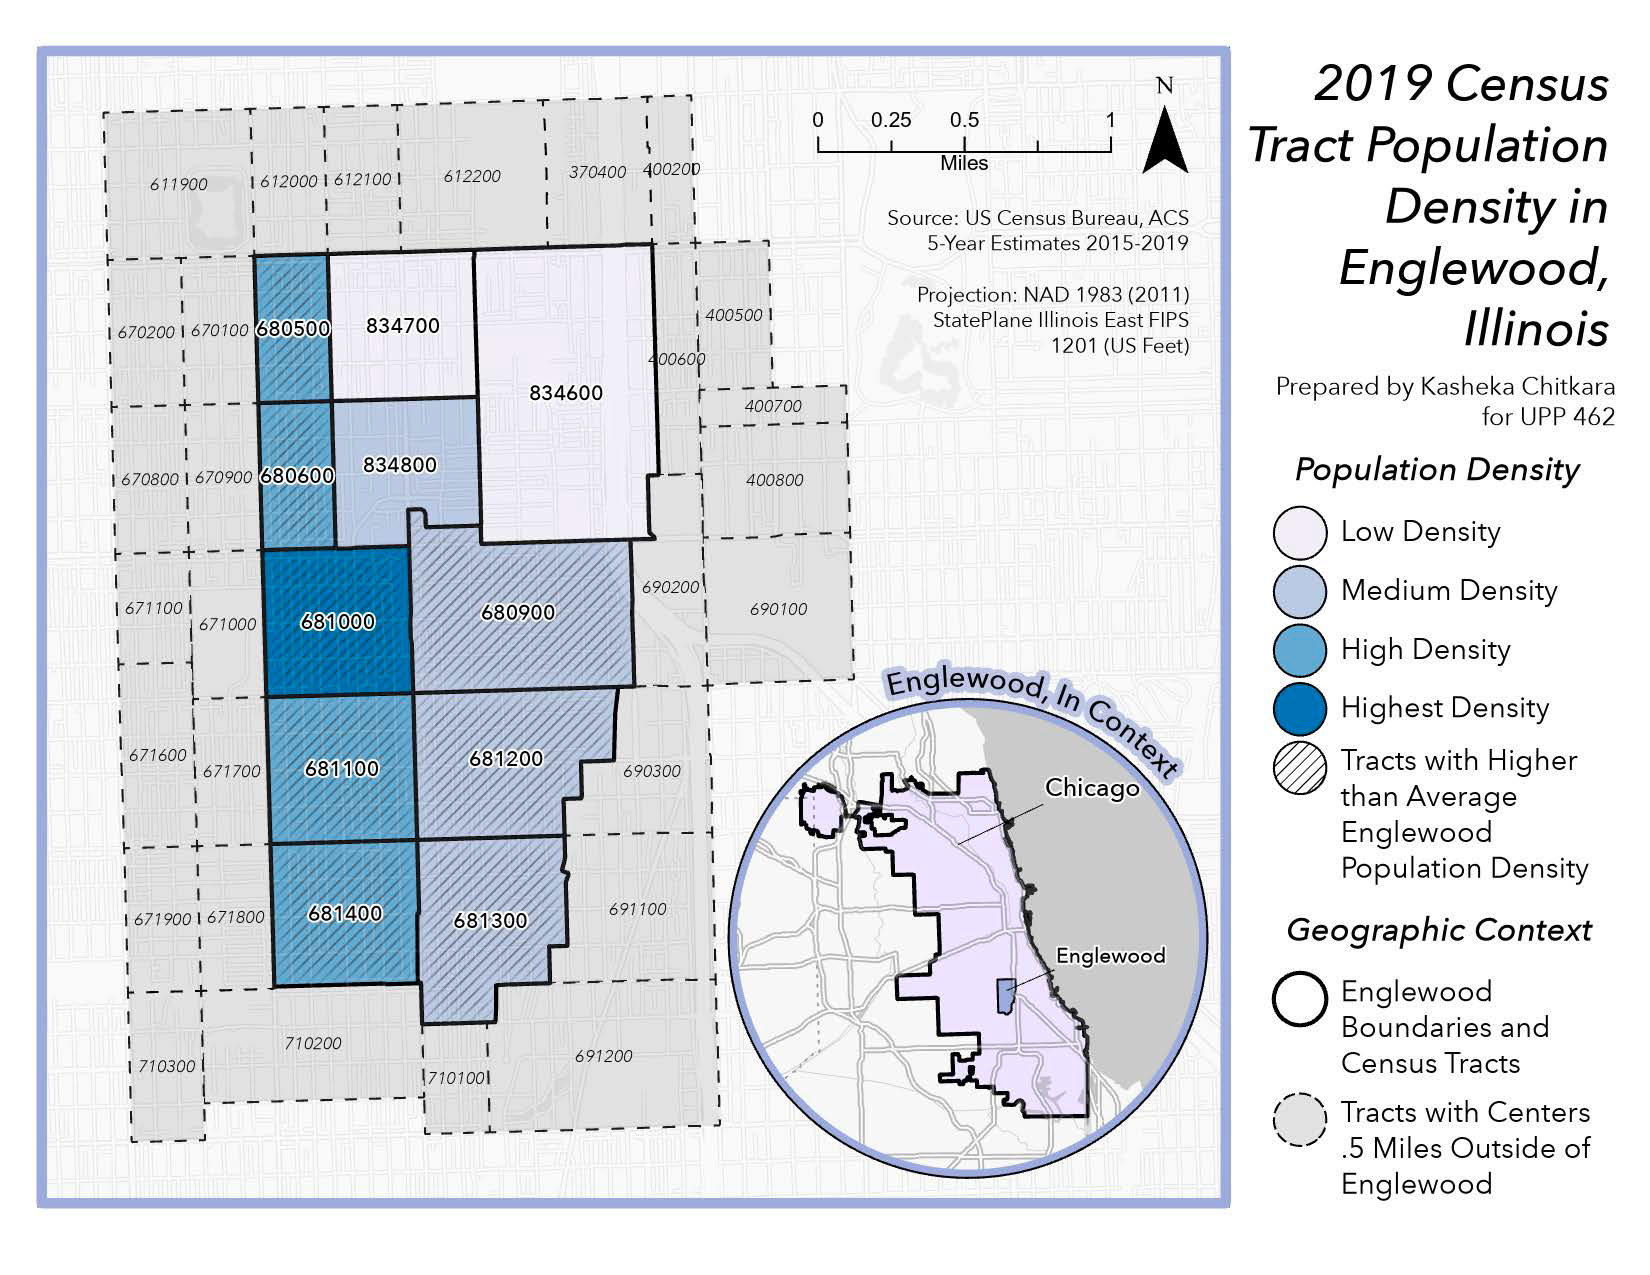
GIS map visualizing population density in Englewood, Chicago, using census data to highlight patterns of residential concentration across the neighborhood.
Skills: ArcGIS Pro
Hotspot and Average Distance Analysis
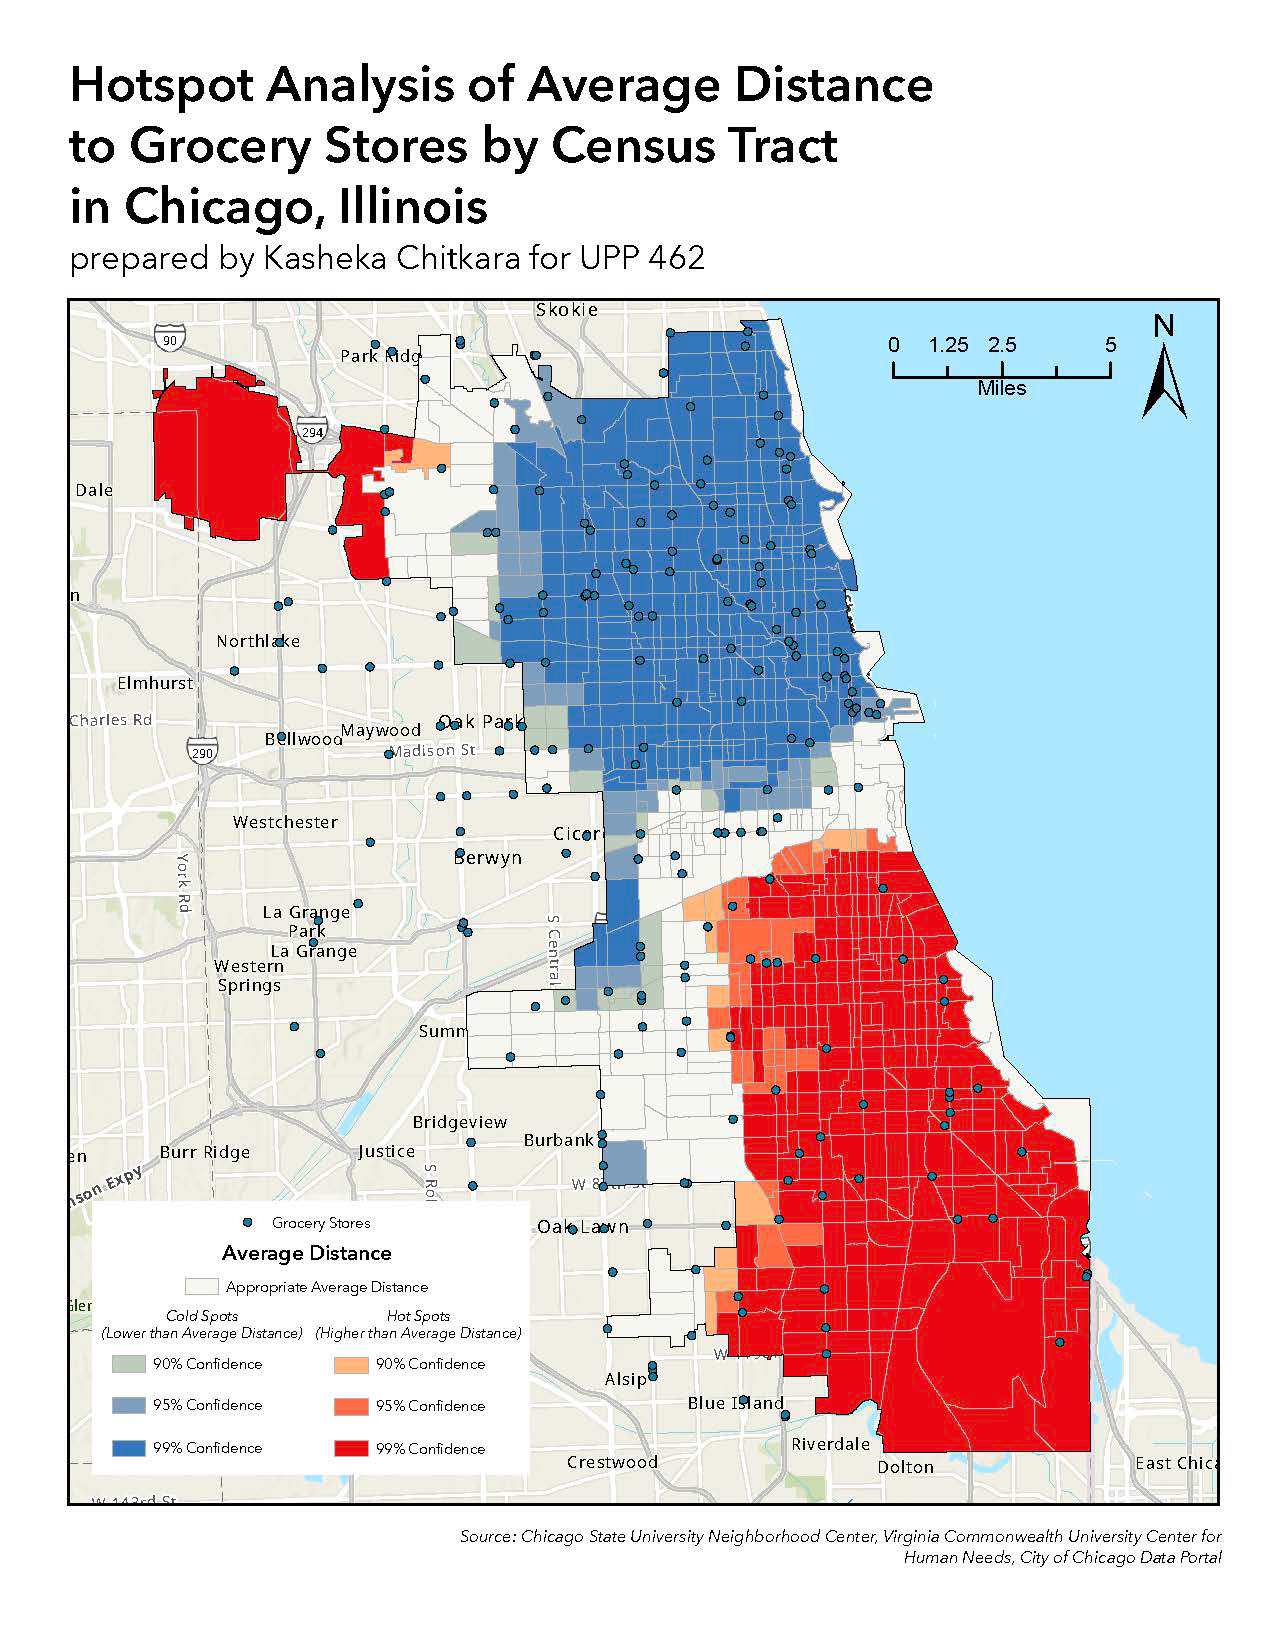
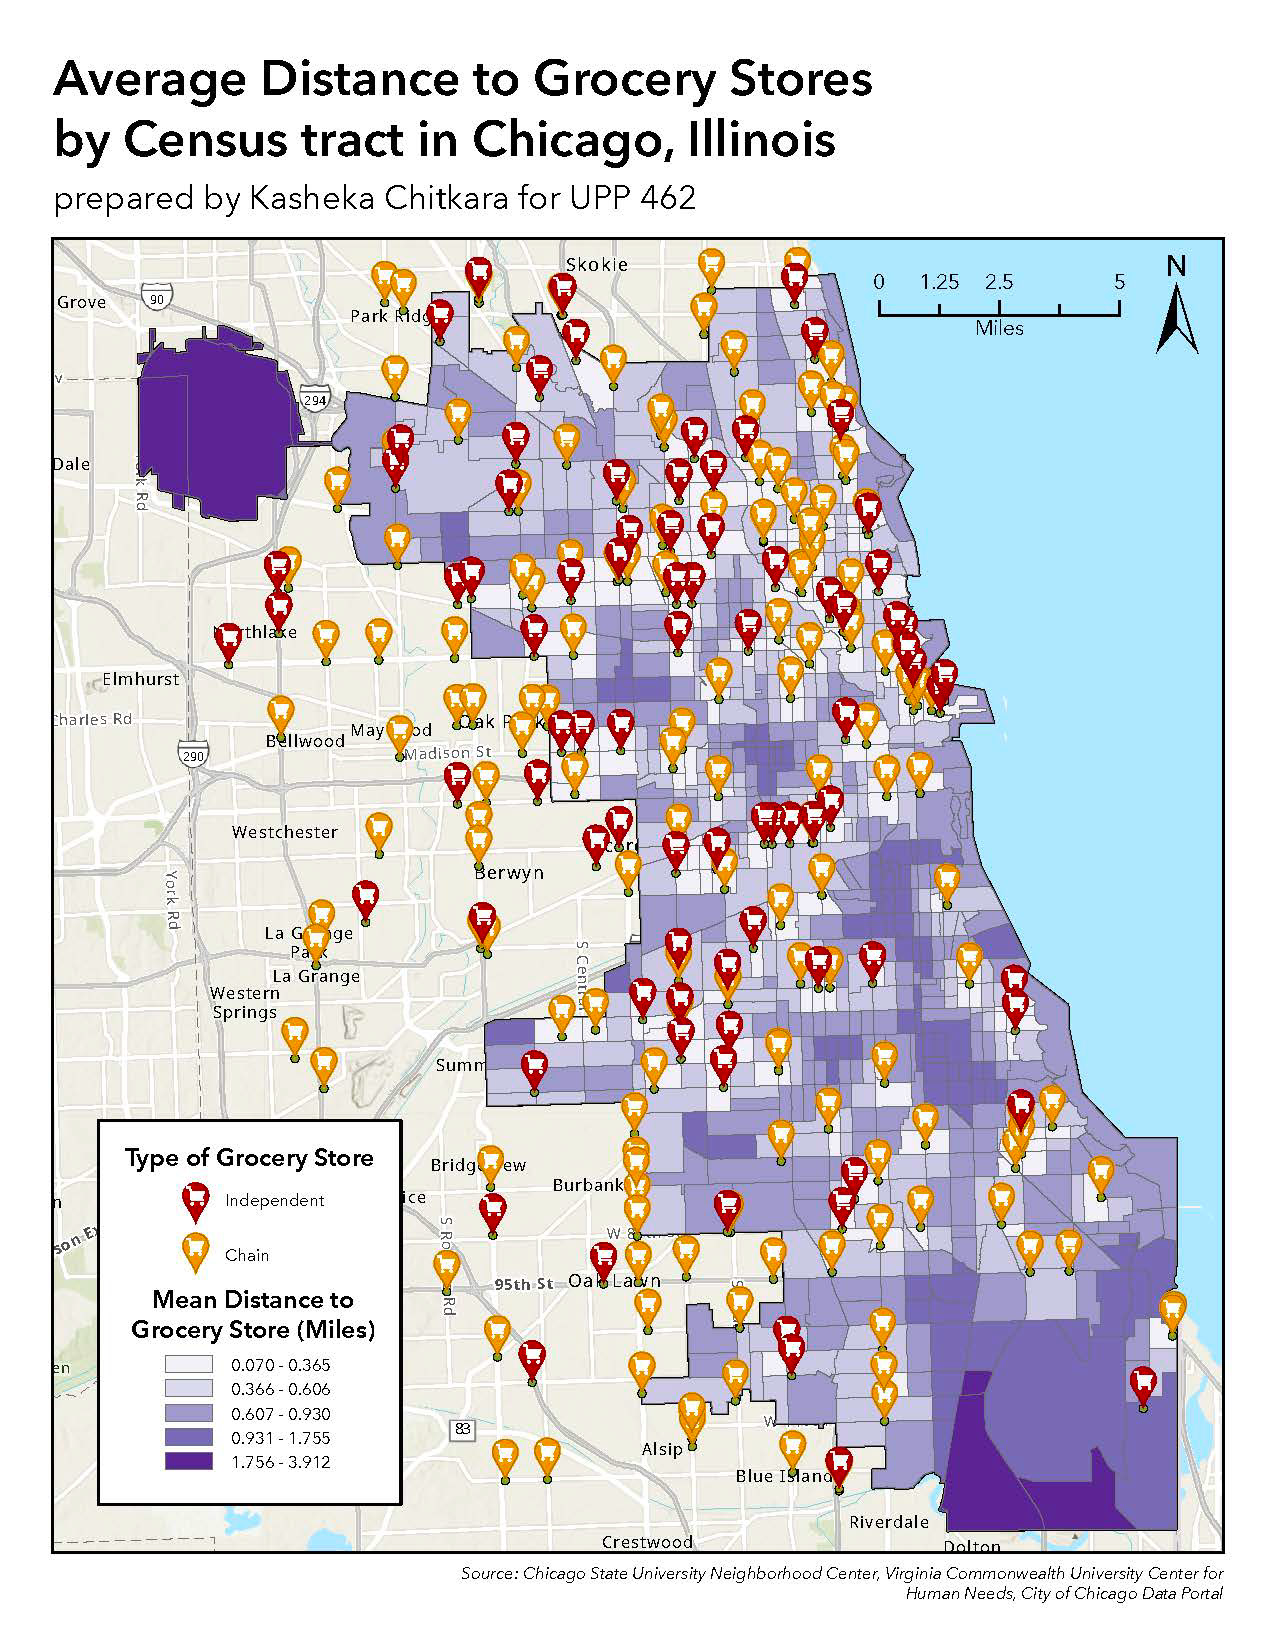
Hotspot and average distance analysis of access to grocery stores by census tract in Chicago, Illinois, identifying spatial patterns of limited food access and highlighting areas with the greatest travel burden to reach grocery retailers.
Skills: ArcGIS Pro
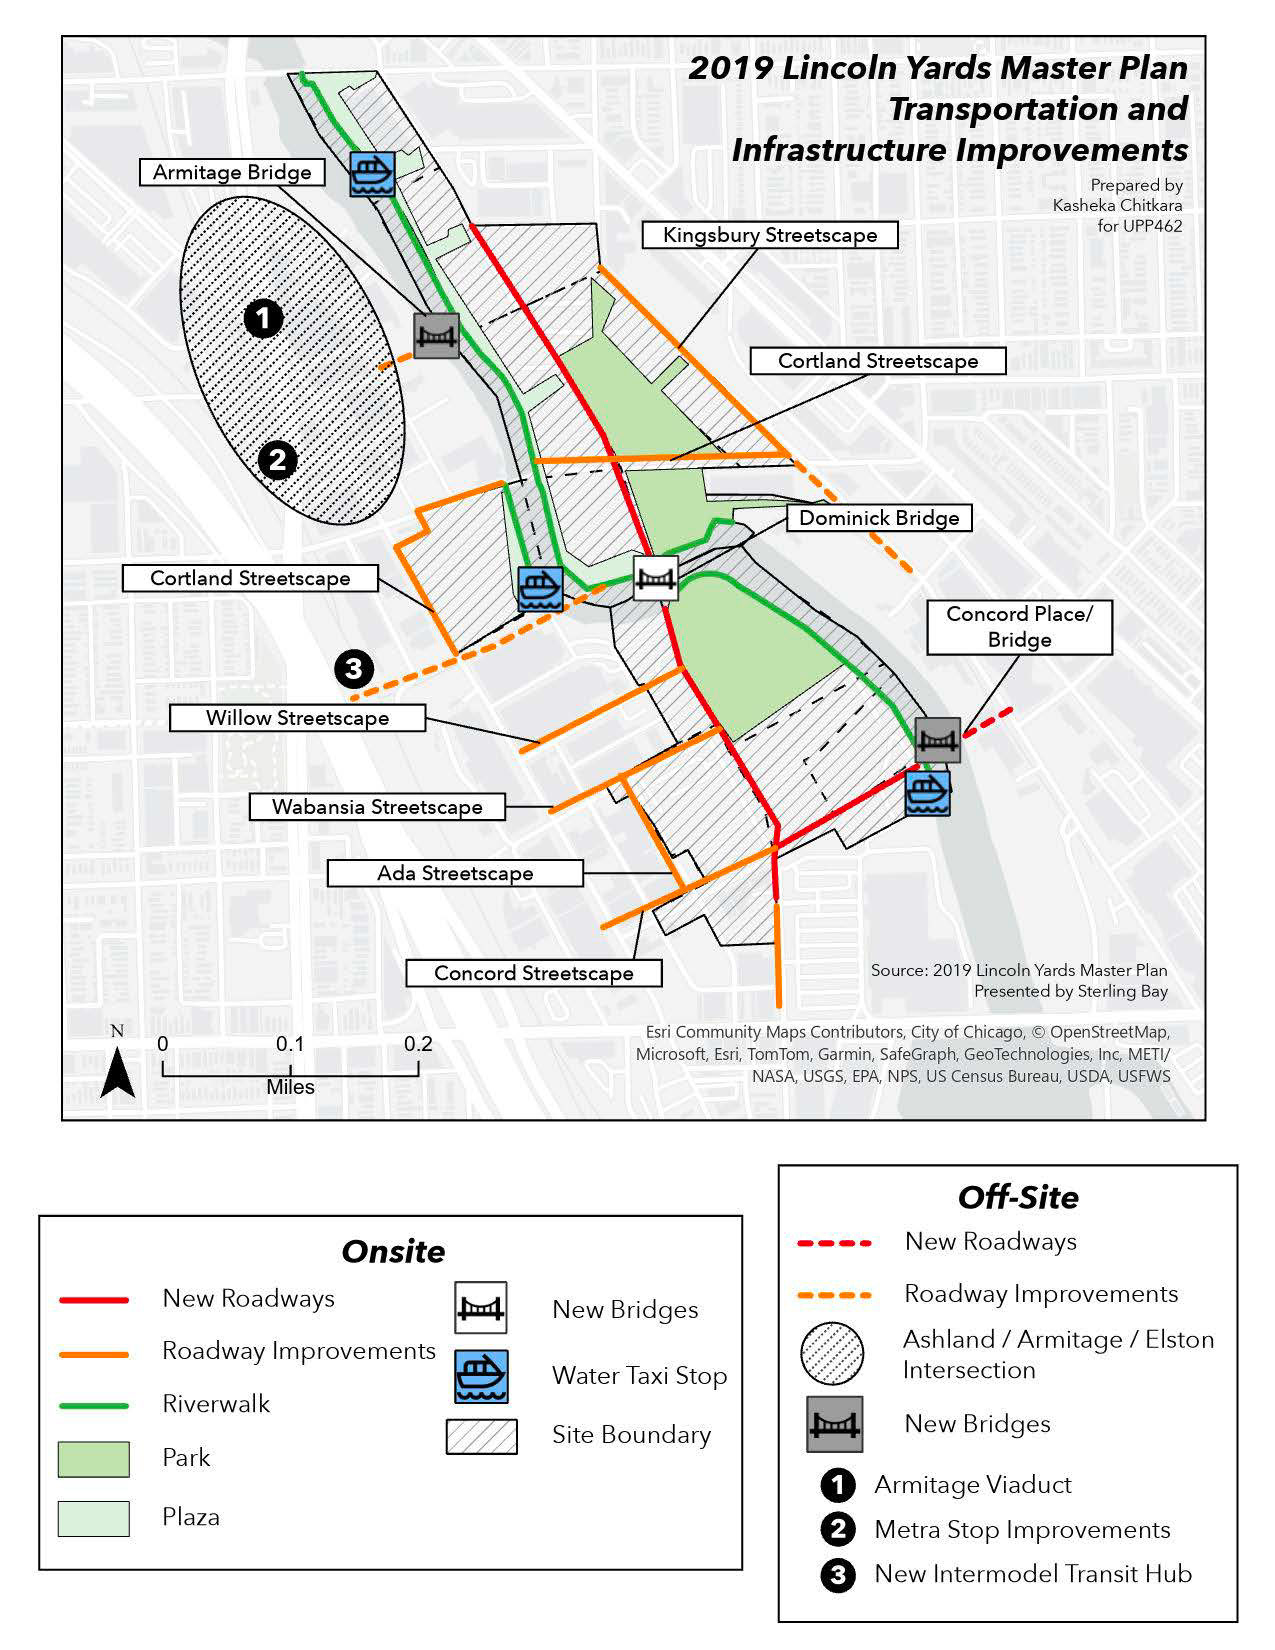
Map Digitization
Map created through digitization to visualize the Lincoln Yards Master Plan in Chicago, focusing on proposed transportation and infrastructure improvements across the development area.
Skills: ArcGIS Pro
StoryMap: Connect Chicago Accessibility Analysis
Connect Chicago is a network of over 250 free internet and digital learning hubs located in libraries, community centers, and other public spaces. This analysis evaluated the accessibility of these locations for families with school-aged children in Chicago, particularly those living below the poverty line.
Skills: ArcGIS Pro